Visit

Main Content Area

Accessibility for Photos, Charts, Graphs and PDFs

How to Describe Images to Make Them Accessible

Images are often used on web pages, apps, documents, presentations, and PDFs - for content that you have created, or content obtained from a third-party source. For digital accessibility, there are several types of images to consider, and most will need to be described with alternative text or sometimes with long descriptions. Today, we’ll discuss photographs, icons, decorative images, logos, and complex images of text like charts, graphs and others, and I’ll provide sample text descriptions. Feel free to ask questions at any point.

Photographs

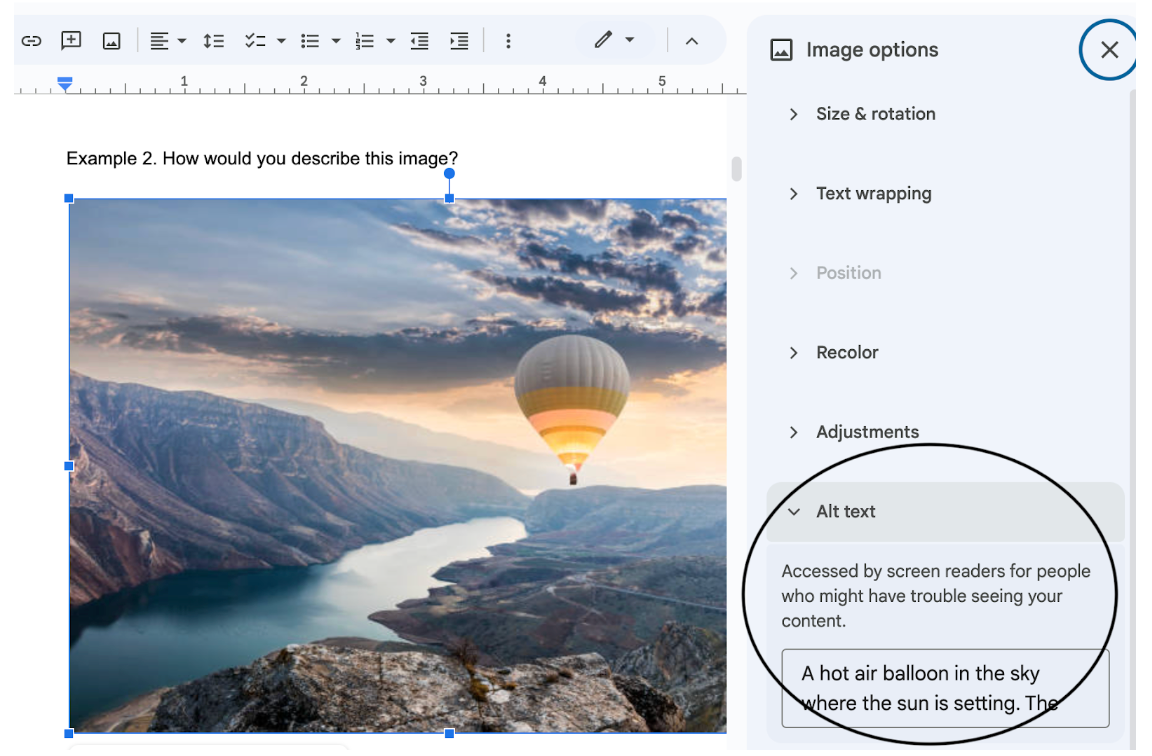
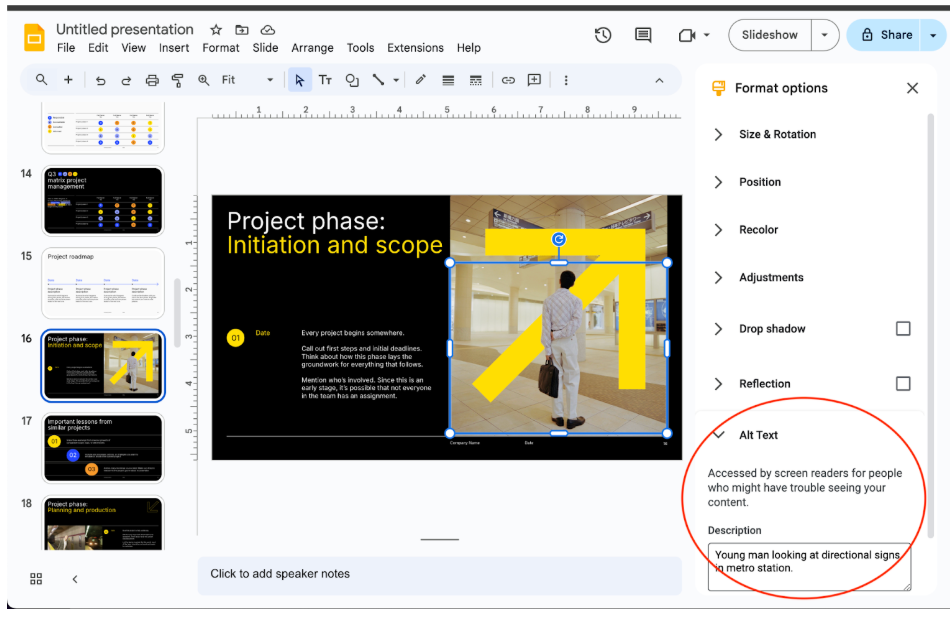
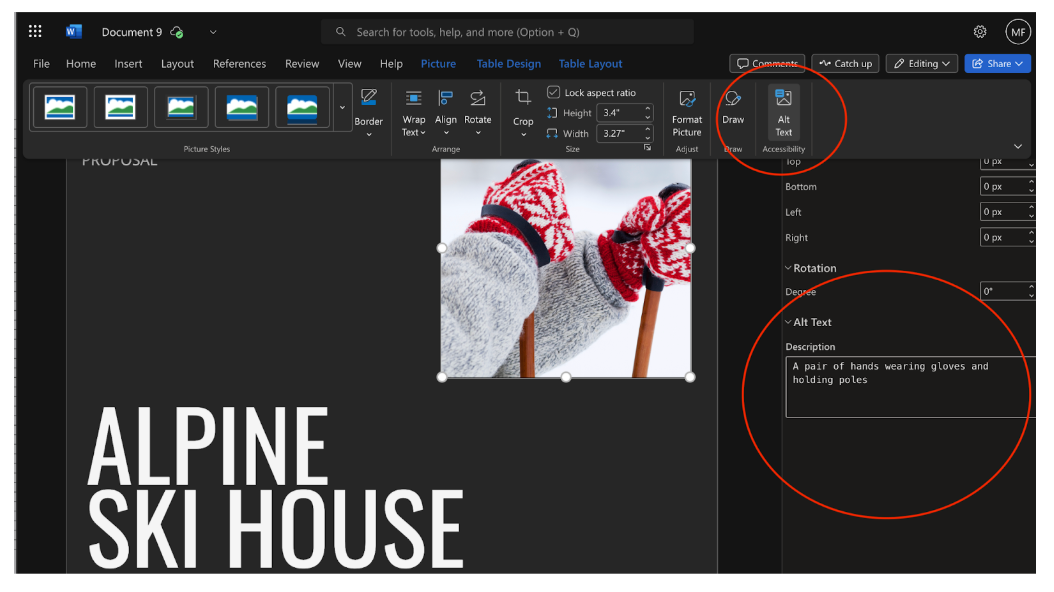
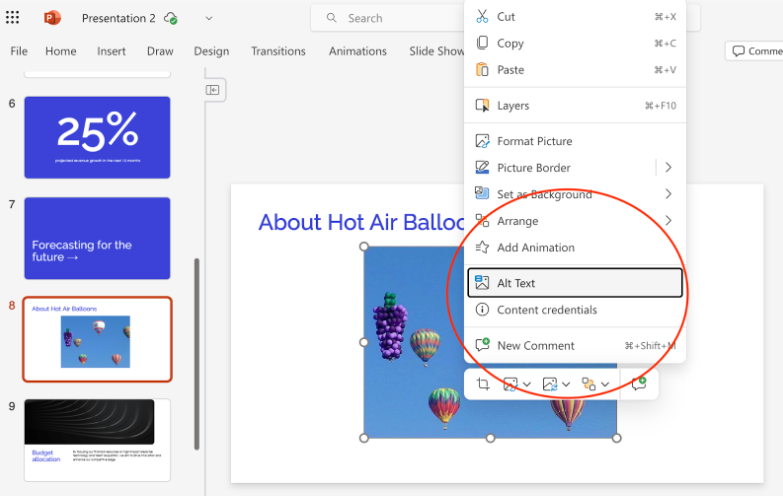
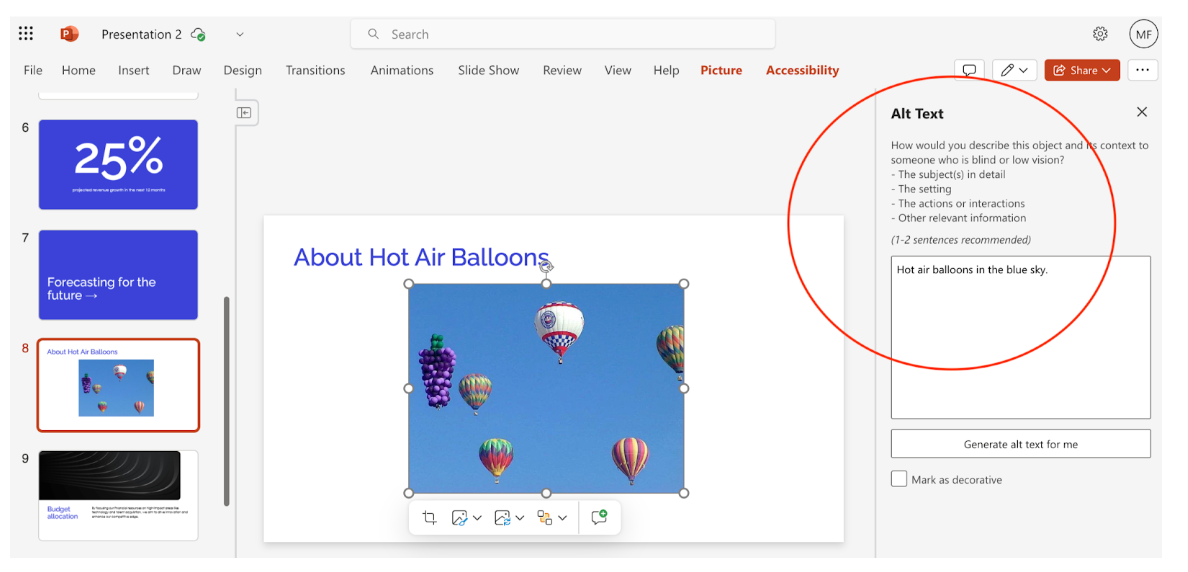
For people who use screen readers, alt text descriptions can make image content accessible. When writing alt text for photographs in websites, apps, documents, presentations, and PDF files: 

  1. Provide a clear, simple explanation and context for what the photograph depicts - people, places, purpose, things.
  2. Don't write “image/photo of” — screen readers already describe images as such.
  3. Keep it brief - one or two short sentences up to 120 characters.

*When alt text is used in HTML web pages - add the code: alt=”” (text description between the quotes)

Example 1. New York City Brooklyn Bridge skyline on the East River. One World Trade Center and other buildings in the background.

Photography of Bridge during Nighttime · Free Stock Photo

Example 2. The blue sky with clouds.

Blue sky with clouds - from istockphoto.com

Alt text for Photographs in Google Docs and Slides and Microsoft Word and PowerPoint

  • How to do alt text for Google Docs
    • Right click on the image < Image options < Fill out alt text
  • How to do alt text for Google Slides
    • Right click on the image < Format options < fill out alt text
  • How to do alt text for Microsoft Word
    • Picture menu < Click on alt text < Fill out alt text
  • How to do alt text for Microsoft PowerPoint
    • Right-click on the image < Select Alt text < Fill out alt text

Decorative Images

Some images are used as background images to add visual appeal, but don't convey meaning. Commonly described as decorative images, they don’t need alt text. 

Example of a decorative image. If used in an HTML page, the alt text code would be alt=””
istockphoto.com image

Logos

Logos commonly used on HTML web pages, can be graphics that may or may not have text in them. The organization name that they represent still needs to be described with alt text.

Example 1. Alt text for the Aims Community College logo would be alt=”Aims Community College”

https://www.aims.edu/

Example 2. From the tv show LOST (Click link below and scroll to bottom of webpage to see example logo) -  the alt text for the airline logo Oceanic Airlines would be alt=”Oceanic Airlines” 

Oceanic airlines logo

Complex Images of Text That Convey Meaning

  • The first rule of using complex images of text is to only use them if you really need to - for content that you have created or obtained from a third-party source. 

  • If the information you are using doesn’t need to be an image, and you can easily present the information in an HTML or text format, that would be good to do. 

  1. People with visual impairments can have issues accessing these types of images:
    1. If a font-size is less than 9 points, it can be really difficult to read.
      1. When people with visual impairments try to zoom into small text on an image - this will look pixelated.
    2. If a font color doesn't have sufficient contrast against the image background, the text can be hard to read. 
       
  2. If you need to present things like graphs, charts, diagrams, infographics, maps, and illustrations, etc., as complex images of text:
    1. Use both alt text and a long description to convey meaningful information that students need to know for an exam or to understand the context of the lesson.
    2. Otherwise, screen reader users will not be able to access the text in the image.
       
  3. Start by placing alt text on the image defining what it is and stating that a long description is adjacent to the image.
     
  4. Then, provide a long description there:
    1. What the image of text is about: the information that conveys meaning
    2. The context in the overall lesson
    3. All information that a student would be expected to know on an exam
       
  5. In a D2L course, Panorama will only ask you to provide alt text for complex images of text, (limitation of Panorama) but we still need to provide a long description adjacent to the image.

When You Don't Need a Long Description

If the main content where charts and graphs are displayed already has a text explanation that contains this information:

  1. What the image of text is about: the information that conveys meaning
  2. The context of how this image relates to the overall lesson
  3. All information that a student would be expected to know on an exam about this image

Then you don't need to provide an additional long description. The alt text for the image of text would need to say something like: “This is a chart about ____.  A description is in the main content.”

Some Examples

1. Example of a chart
Concept draw chart example

Long description: 

The image shows a pie chart with 18 slices, each representing a different business sector. The chart is a visual representation of how a certain value is distributed across these sectors.

Banks (8.42%) | Food Producers & Processors (8.39%) | Mobile Telecommunications (7.81%) | 
Oil & Gas Producers (7.39%) | General Retailers (7.36%) | Mining (7.02%) | Construction & Materials (6.22%) | Aerospace & Defence (5.60%) | Support Services (5.53%) | Gas, Water & Multiutilities (5.45%) Electricity (5.25%) | General Financial (4.46%) | Beverages (4.11%) | Life Insurance (4.07%) | Tobacco (3.79%) | Travel & Leisure (3.42%) | Pharmaceutical & Biotechnology (3.28%) | Media (2.43%)

2. Example of a graph

Visual capitalist Share of Global GDP

Long description:

The graph, "SHARE OF GLOBAL GDP", shows the percentage of the world's total economic output (Gross Domestic Product) held by the six largest economies from 1980 to 2024.

Each line on the graph tracks the share of global GDP for one of these economies over time. The U.S. share fluctuates between roughly 20% and 30%, while China's share has grown significantly since the late 1990s. 

The current estimated shares for 2024 are provided on the right side of the chart:

U.S.: 26.3% | EU: 17.3% | China: 16.9% | Japan: 3.8% | India: 3.6% | UK: 3.2%

The graph uses data from the IMF World Economic Outlook (April 2024) and notes that the figures are based on GDP in current prices. The overall message is a visual comparison of the economic power of these major global players and how their relative positions have changed over the past four decades.

3. Example of a mathematics equations - the quadratic equation

How to Solve a Quadratic Equation: 3 Methods - HubPages

Long description

A quadratic equation is a polynomial equation of the second degree. It's written in the standard form:

ax2+bx+c=0

Where a, b, and c are coefficients, and a cannot be zero (if a were zero, the term ax2 would vanish, and the equation would no longer be quadratic). The variable x represents an unknown value. The solutions to a quadratic equation are also known as its roots or zeros, and they correspond to the x-intercepts of the equation's graph, which is a parabola.

4. Example of a Venn diagram
Understanding Venn diagram symbols — with examples | Nulab

Long description: 

The Offline/Online Marketing Landscape illustrates how various marketing channels and strategies intersect, categorizing them into four main areas: Brand, Advertising, Lead Gen, and Sales. The diagram emphasizes that Mobile Content is at the center of all these functions. Offline vs. Online Division: The top half of the diagram is dedicated to Offline strategies, including "Stores" and traditional media like TV and print. The bottom half focuses on Online methods, such as websites, social media, and email marketing.

5. Example of an infographic
28 Awesome Infographic Examples for Your Inspiration | RGD

Long description: 

"Peace of Mind? BACK IT UP!", highlights the importance of data backup and reveals most people don't do it. It presents key statistics from a Seagate survey.

  • A significant 54% of adults have personally lost or know someone who has lost files.
  • Most valued digital assets are photos & videos (72%), school work & projects (35%), and music (31%).
  • Only 10% of people back up their data daily, with 25% admitting they never back up.
  • A greater percentage of women (30%) than men (19%) do not back up their data.
  • The most common backup methods are external hard drives (27%), USB flash drives (18%), DVDs (9%), and cloud services (8%).

6. Example of a map

Map of London Boroughs

Long description: 

This map displays the 32 London boroughs and the City of London, each identified by name and color. The River Thames, which flows through the city, is also visible, serving as a key geographical reference. The boroughs are divided into two main groups:

  • Inner London (12 boroughs, plus the City of London): These boroughs are typically smaller in area and population but have a much higher population density. They include Camden, Greenwich, Hackney, Hammersmith and Fulham, Islington, Kensington and Chelsea, Lambeth, Lewisham, Southwark, Tower Hamlets, Wandsworth, and Westminster.
  • Outer London (20 boroughs): These boroughs are generally larger and less densely populated. They include Barking and Dagenham, Barnet, Bexley, Brent, Bromley, Croydon, Ealing, Enfield, Haringey, Harrow, Havering, Hillingdon, Hounslow, Kingston upon Thames, Merton, Newham, Redbridge, Richmond upon Thames, Sutton, and Waltham Forest.

7. Example of an illustration

https://www.theguardian.com/lifeandstyle/2014/may/20/how-to-mend-a-bike-puncture

Long description: 

The key message of this illustration: “How to fix a bike tube” is that you can fix a punctured inner tube rather than throwing it away, which saves money and extends its life. The illustration lists the essential tools for repairing a bike puncture:

  • Tweezers and chalk to find and mark the hole.
  • Rubber solution and a patch to fix it.
  • A bucket of water to locate the puncture.
  • Sandpaper to prepare the surface.
  • Tyre levers to remove the tire.
  • A pump to re-inflate the tube.

Demo: Using Google Gemini to generate long descriptions

  1. First: go to Google Gemini at https://gemini.google.com/app
  2. Upload the image into the prompt window that you want to have described.
  3. Beneath that type a prompt like: "Describe the key information in this image."
  4. Also type in any background information that will help Gemini write an effective image description.
  5. Check the generated text for accuracy, proper context, spelling errors.
  6. You may need to add your own text to what Gemini writes to create the best long description possible, but using Gemini can help get you started.

We’ll practice with a couple of images below.

1. Example to use with Gemini
15 Infographic Examples for Students (Plus Editable Templates) - Piktochart
The long description would go here.

2. Example to use with Gemini

Line graphs - KS3 Maths - BBC Bitesize

The long description would go here.