Importance of providing semantic structure
Doing this refers to adding the underlying code that provides semantic structural meaning to equations, formulas, and scientific notation to enable assistive technologies to understand and access logical relationships within mathematical and scientific information. This is separate from visual appearance.
Using MathML with HTML pages
Prioritize using MathML
- A World Wide Web Consortium (W3C) specification with support across all major web browsers and most math/science applications.
- MathML provides code that renders a graphical display of equations, formulas, and scientific notation in HTML5 web pages, with the coded semantic structure necessary for screen readers to interpret them.
- Basically, it’s a recommended standard because it provides both semantic structure and meaning, and is displayed as an image.
- Because MathML needs to be coded in a specific way, you can use a tool like MathType to generate equations in the MathML format, and then use MathJax to render those MathML equations within HTML5 pages.
- MathML is also essential for the JAWS screen reader on the PC for the reader to be able to read equations, formulas, and scientific notation.
- Also, Microsoft Word uses a format called Office Math Markup Language (OMML). If you have MathML code, you can copy and paste it directly into Word. Word should recognize the markup and convert it into a professional-looking equation.
- For further information on the process of how to use MathML for your equations, formulas, and scientific notations, here is a YouTube video that explains how to work with MathML and HTML5: Accessible Math on the Web: Part 2, The Simple Way with MathML and HTML5 - Greg Kraus, NC State.
Using LaTeX
You can also use LaTeX (a system for preparing high-quality documents) for math and science equations, formulas, and scientific notation, but these are rendered as visual elements or specialized characters, with no underlying semantic structure. To provide semantic information for screen reader users: transform the LaTeX source into HTML using MathJax which reads code and generates two outputs:
- A high-quality visual representation of the equation.
- An invisible MathML structure, which screen readers can navigate and interpret semantically.
Other digital tools
Instructors and students can also create equations, formulas, and scientific notation using Equatio, MyOpenMath, and Google Docs equation editor, with Equatio.
EquatIO
Equatio is designed to turn handwriting, speech, or typed shortcuts into professional-looking formulas. It is available as a standalone software program and also as a Google Chrome Extension: best for Google Docs, Sheets, and Forms.
- When you insert an equation, Equatio automatically embeds alt text that screen readers announce to users with visual impairments.
- Check that the alt text properly reads and describes the formula or equation the way that you need it to.
- Note: if the alt text generated is more than 120 characters, (screen readers may not read more than that):
- Will need to place this alt text as a long description adjacent to the formula or equation.
MyOpenMath
- MyOpenMath uses technology like MathJax to display equations in a way that screen readers can interpret and read them accurately.
- A blind student accesses MyOpenMath primarily through assistive technology, and would need visual content converted to auditory or tactile formats.
- Students can enable specific screen reader settings within their MyOpenMath profile to optimize the platform's layout and feedback for their assistive technology.
- These students may also use keyboard navigation to move through the interface, enter answers, and interact with problems.
Google Docs equation editor
- The built-in Google Docs equation editor does not natively generate MathML that allows screen readers to understand semantic meaning of math or science equations and others.
- As a result, when generating an equation, screen readers may only read the equations as a flat string of characters and symbols. You can add alt text to the equations and provide a long description adjacent to the equation.
- If you use Google Docs instead of an HTML page that renders MathML:
- Use an add-on like Equatio to generate an image of an equation that is provided with alt text to describe it.
- Just make sure that the alt text is written in a way that properly describes the equation in the exact way that it is visually displayed.
- If the alt text is longer than 120 characters, then place it adjacent to the equation as a long description.
Graphs, charts, diagrams, illustrations for math and sciences
- As a reminder, only use complex images of text if you really need to.
- Place alt text on the image defining what it is. Then state that a long description is adjacent to the image.
- Then provide a long description of a couple of sentences that conveys the following information:
- What the image is about, explaining any patterns of data.
- Information a student would need to know for an exam.
- The context of how this image fits into the overall lesson.
- Otherwise, screen reader users will not be able to access the information in the image.
- If you already provided this information in the main content, then you don’t need a long description.
Using Google Gemini to generate long descriptions
- First: go to Google Gemini at https://gemini.google.com/app
- Upload an image into the prompt window that you want to have described.
- Beneath that type a prompt like: "Describe the key information in this image. What is the information conveyed in the graph, chart, or diagram?
- Also type in any background information that will help Gemini write an effective description.
- Check the generated text for accuracy, proper context, spelling errors.
Examples of complex images
Chemical element on the periodic table example
- When describing a single element from the periodic table, write out the four property labels in narrative form as listed in the periodic table, from top to bottom.
- Provide the physical location on the periodic table.
Magnesium Periodic Table Elements — Stock Photo © WE_S #292566608
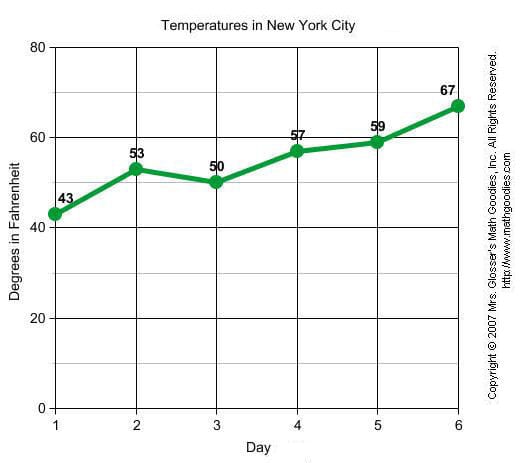
Line graph example
Line graph example
Use a paragraph or bullet points to explain the data and trends logically:
- Axis Details: State the X-axis and Y-axis and their units.
- Key Trends: Describe the overall story.
- Data Points/Values: State specific, important data points.
- Multiple Lines: If the graph has multiple lines, describe the trend for each line individually,
and then compare the relationships between the lines.
Line Graph Definition
Bar graph example
Bar graph example
- Title and Axes: State the chart's title and name the X-axis and Y-axis.
- Key Trends: Describe the overall pattern.
- Specific Findings: Highlight minimum, maximum, and any significant dips or changes.
- Relationships: Explain any relationships focused on in the graph.
What is Vertical Bar Graph - Definition, Examples, Facts
Scatter plot example
Scatter plot example
- State the chart type, title, and name the two variables being compared (X-axis vs. Y-axis), and describe the overall correlation/trend.
- Discuss the relationship and pattern of the data points, which is the plot's primary purpose.
How to Make a Scatter Plot: A Comprehensive Guide


